
G+ May 2024 Market Update

As we have seemingly averted the looming recession, and continued signs of increasing consumer confidence are increasing, we are expecting a surge in demand in NYC real estate properties. This will likely incite a significant bump in activity as buyers and sellers, who were previously waiting on the sidelines are poised to jump back in. Interest rates appear to have peaked, and the surge in new listing activity should guide the FED into a couple of rate decreases before the end of the year. All this combined leads to a renewing confidence in the NYC real estate market and a very strong finish to 2024. Please continue reading for a more in-depth report on the year to date status of the NYC market.
As arduous as housing affordability is for renters, it is even more dire for all but the most affluent prospective homebuyers. Based on data from StreetEasy, the median sales price for homes that sold in 2023 was $764K, down about 2% from a record high of $782K in 2022 but back up to $785K in early 2024. However, compared with the months leading up to the pandemic, the city’s median home price has risen far less dramatically than nationwide: up roughly 16%, compared with 42% nationwide, corresponding to average annual price growth of roughly 4% (locally) and 10% (nationally).
One factor bolstering home prices is a relative dearth of inventory. The inventory of homes available for purchase, as shown in Chart 1 below, has declined steadily over the past three years and is just about at a seven-year low. In addition to the restraint on supply caused by a chronic shortfall of new housing development (highlighted in our February Newsletter), the rapid rise in mortgage rates over the past two years has created a condition called “housing lock”. That is, many homeowners who might otherwise be inclined to sell are reluctant to give up the exceptionally low mortgage rate that they locked in while rates were low, or to sell at prices they perceive may be lower given prospective buyers’ higher rates.

Profile of the Owner-Occupied Housing Stock
The homeownership rate in New York City is 30%—well below the nationwide average of 66%. Overall, the homeownership rate has barely changed over the past decade, though a couple dimensions of it have. As is the case nationwide, the most traditional segment of owner-occupied housing is single-family homes. However, as shown in Chart 2 below, the proportion of single-family homes that are renter-occupied has more than doubled since 2005: it rose steadily up until 2017 and that rise accelerated following the onset of the pandemic. The share of condos occupied by renters has also risen substantially since the pandemic.

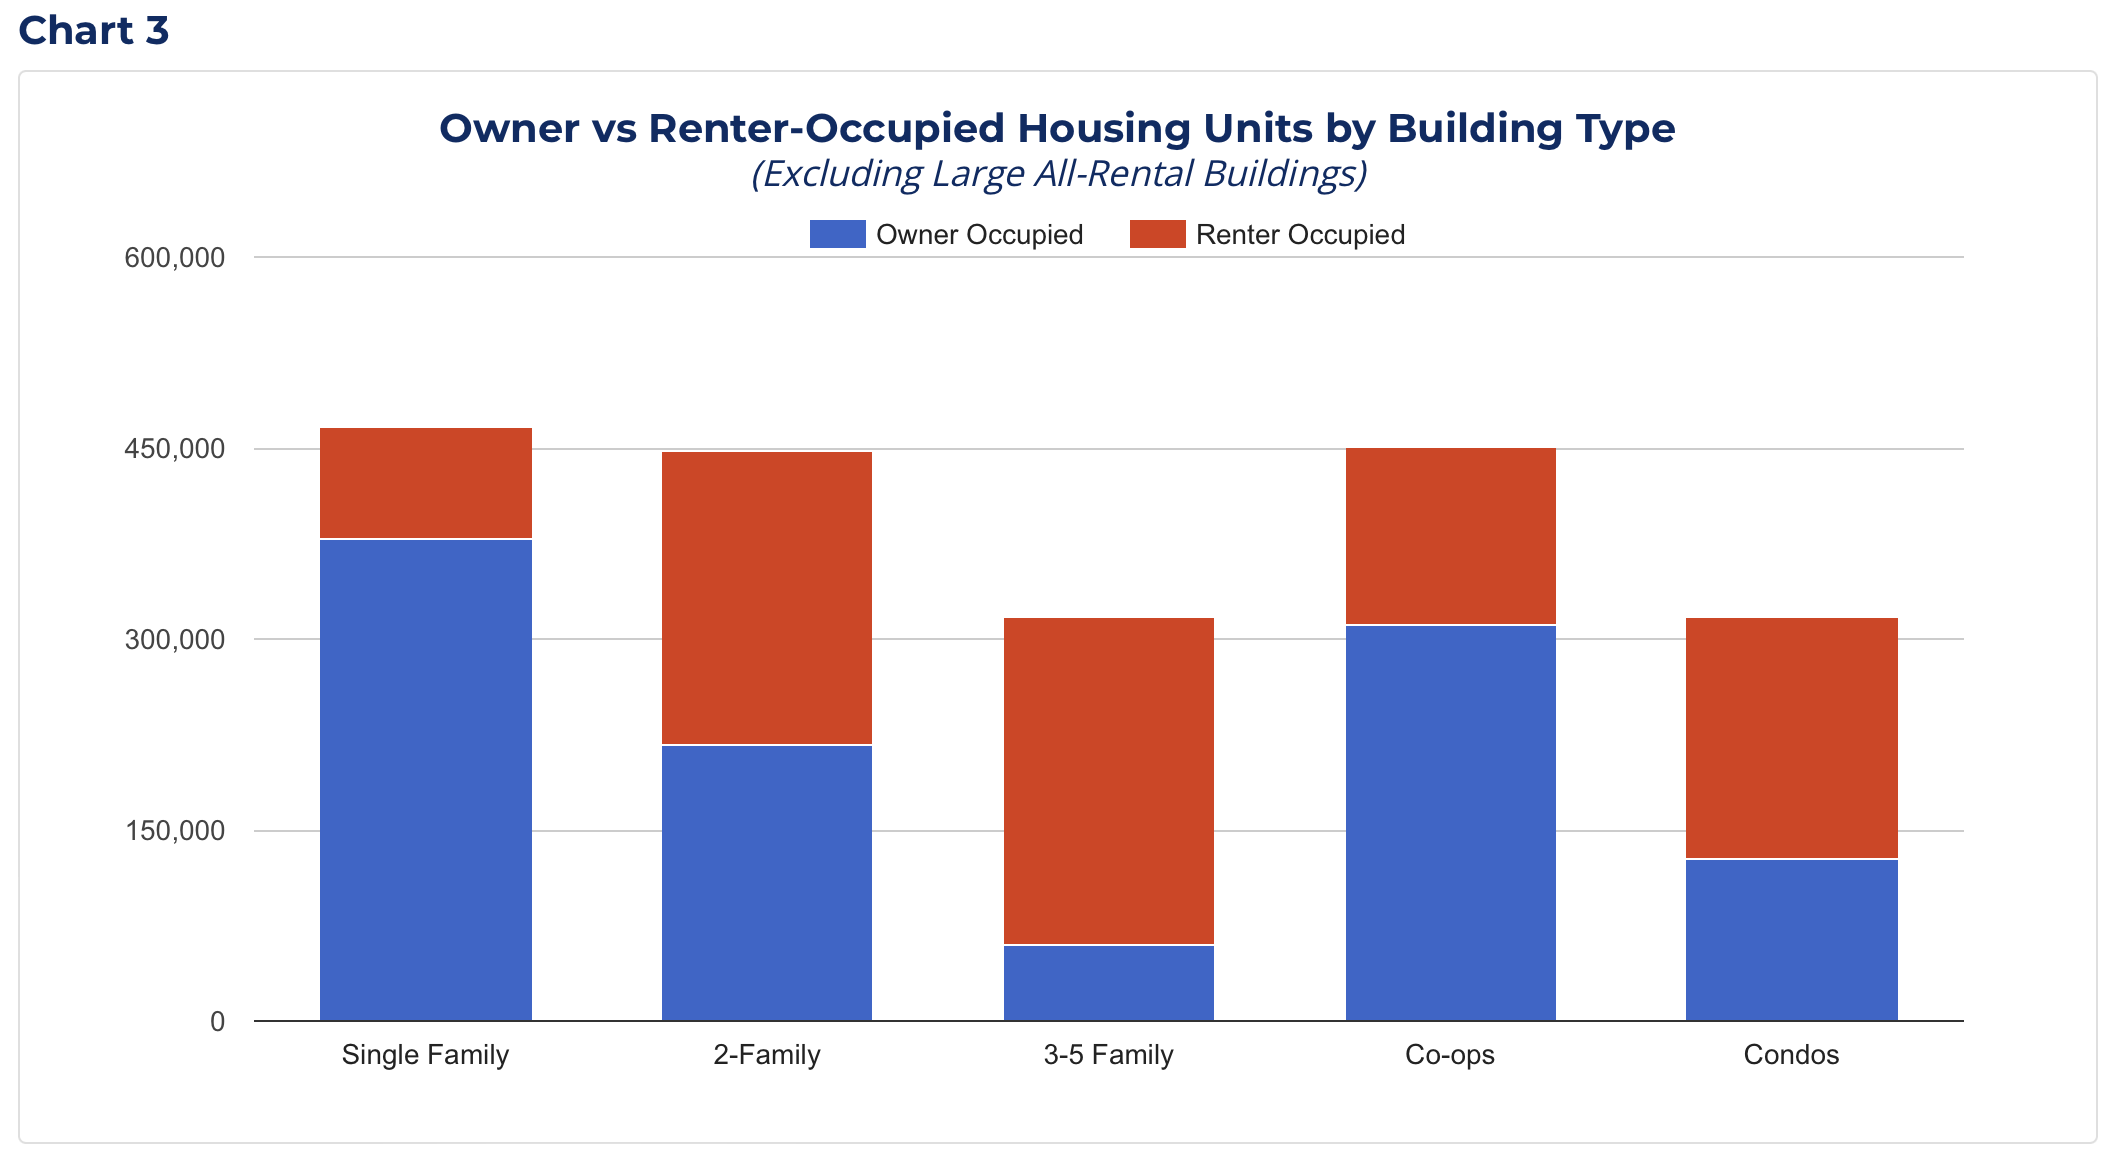
As of 2023, there were estimated to be 466,000 single-family homes in the city with about 378,000 (81%) owner-occupied. As shown in Chart 3 below, this accounts for roughly 28% of all owner-occupied housing in the city. There are approximately 225,000 two-family structures, where the homeowner typically (but not always) lives in one unit and rents out the other. There are 216,000 such owner-occupied units in these structures, accounting for slightly more than 20% of all owner-occupied homes. Both one- and two-family homes are almost exclusively found in the outer boroughs (outside Manhattan). There are another roughly 77,000 homeowners living in three-to-five-family family and other multi-family buildings that are not co-ops or condos—this is generally because the building owner lives in one unit and rents out the rest.
Finally, there are 450,000 occupied apartments in cooperative buildings and another 318,000 in condominiums, together accounting for 22% of the city’s occupied housing stock. However, while rental buildings are, by definition, exclusively filled with renters, buildings developed as condos or co-ops may house a combination of renters and homeowners.
These units, shown in Chart 3 below, may be rental apartments for a number of possible reasons. First, many residents of rental buildings, when they converted to co-ops, opted to remain as rent-stabilized tenants within those buildings. Second, many condo owners purchased their apartment as an investment, with the express purpose of renting it out; in co-ops, this is generally not permitted, though there are exceptions. Third, condo or co-op owners may have initially owned their units to live in but subsequently vacated and are renting out their units. This last scenario may be particularly relevant now, given that many homeowners with low locked-in mortgage rates may be disinclined to sell, even if they’re moving out.
Home Purchase Affordability
One somewhat blunt measure of homeownership affordability is the price/income ratio—that is, how many years’ worth of income would a typical homebuyer need to pay for a typical home? Looking at how this ratio has changed over time can be instructive, though changes in mortgage rates also clearly affect affordability. This ratio has declined slightly since 2010: in 2022, based on the Census Bureau’s American Community Survey, a family earning the median household income (~$75K) buying a median-valued home (~$724K) would be paying 9.7 years of their income. In 2010 the ratio worked out to 10.3 years (holding interest rates constant).
Of course, with mortgage rates considerably higher than in those earlier years, financing that purchase would be more burdensome today for a family at the same income. Another metric, which does capture financing costs, is the proportion of homeowners paying more than 30% of their income on housing costs. This measure, shown in Chart 4 below, provides a clearer indicator of stress on existing homeowners, though it says little about prospective homebuyers—those looking to purchase a home. This measure had been receding throughout the prior decade, likely due in part to falling/historically low interest rates, but turned up since the pandemic, even among homeowners without an underlying mortgage—likely reflecting, in large part, higher utility and insurance costs. Higher interest rates take longer to work their way into this metric, given the length of mortgages, and are likely to push burdens up in the 2025 HVS.

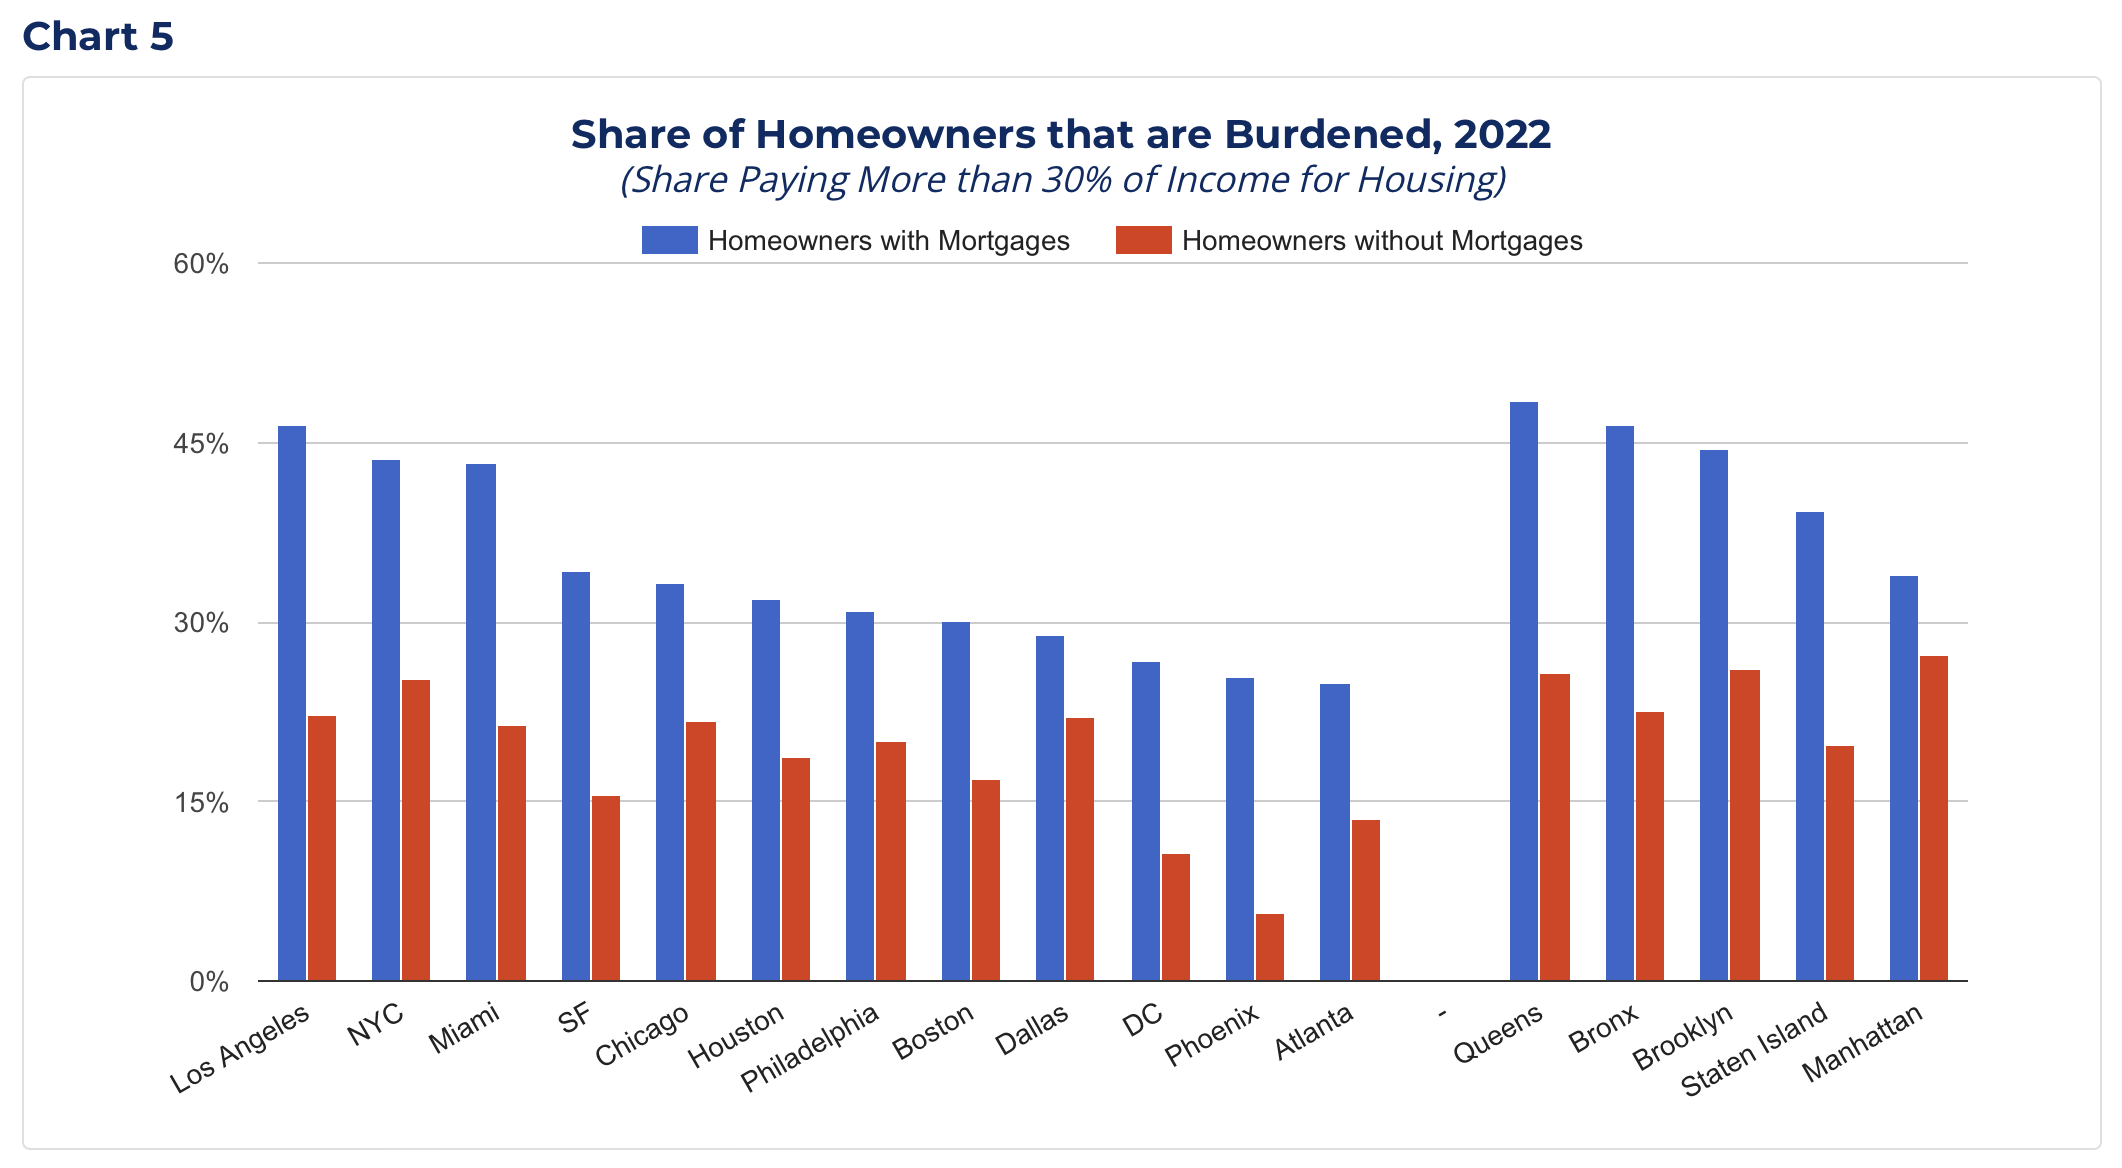
How does New York compare with other major cities on this indicator of homeowner affordability? Not very well. For homeowners with mortgages, more than 40% are housing-burdened, as defined above, which is second only to Los Angeles among top U.S. cities, as shown in Chart 5 below. Within the city, the proportion is highest in the outer boroughs. A recent study by the Federal Reserve Bank of New York found that, at least nationwide, “Low- and moderate-income homeowners were less likely than other homeowners to access lower mortgage rates through refinancing between 2020-2021”, further contributing to housing burden for those homeowners. And even among homeowners without mortgages citywide, nearly 25% are burdened—the highest among all the cities shown here—and on this measure, the proportion is highest in Manhattan.
While rental affordability has worsened considerably in New York City in recent years, price escalation is even worse in the homeownership market. From 2010 to 2022, the price-rent ratio rose from 14 to 18.7—that is, the median cost of a NYC home used to equal 14 years of median rent; today it equals almost 19 years of rent. Put another way, median rent has increased 32%, while the median homeownership price has increased 74%. On top of this, because mortgage rates are somewhat higher now than in 2010, the cost of financing a home purchase adds still more to the relative cost of a home purchase.
The home price statistics discussed thus far pertain to estimated values of all owner-occupied homes across New York City. It is of course, also necessary to look at asking prices for properties that are currently on the market and thus available to prospective homebuyers. Based on listings posted on StreetEasy—totaling over 13,000 as of early March—median asking prices were considerably higher than the estimated median value for all homes noted earlier in the 2022 American Community Survey.
Moreover, current listings can be broken out by borough and type of unit—i.e. co-op, condo, single-family home, 2-3 family home. As shown in Chart 6 below, the only segment of owner-occupied housing for sale with any significant number of available units under $400K is co-ops outside Manhattan. It should be noted, however, that most co-ops come with underlying mortgages and often substantial carrying costs, aside from the unit-owner’s own mortgage.

Conclusion
As expensive as it is to rent a home in New York City, a home purchase tends to be even more stratospheric—both in absolute terms and relative to the past. Moreover, even though many long-time New Yorkers have lived in their owned home for years and paid far less for it than someone would today, many homeowners are struggling to pay their housing costs. Nonetheless, these long-time homeowners are shielded from rising home prices and, in fact, may have accumulated a good deal of wealth as a result. In contrast, those looking to purchase a residence in the city face a combination of high prices and relatively high mortgage rates (at least compared with the past couple decades). Thus, many people and families looking to own their home in the city are priced out of the market.